


Goal 2, Objective 2.2, Measures:
Livable Wage Attainment
Data Vista Metric Definition: Proportion of Students After Exit Who Attained the Living Wage. Among students in selected student journey who exited the community college system and who did not transfer to any postsecondary institution, the proportion who attained the district county living wage for a single adult measured immediately following the academic year of exit
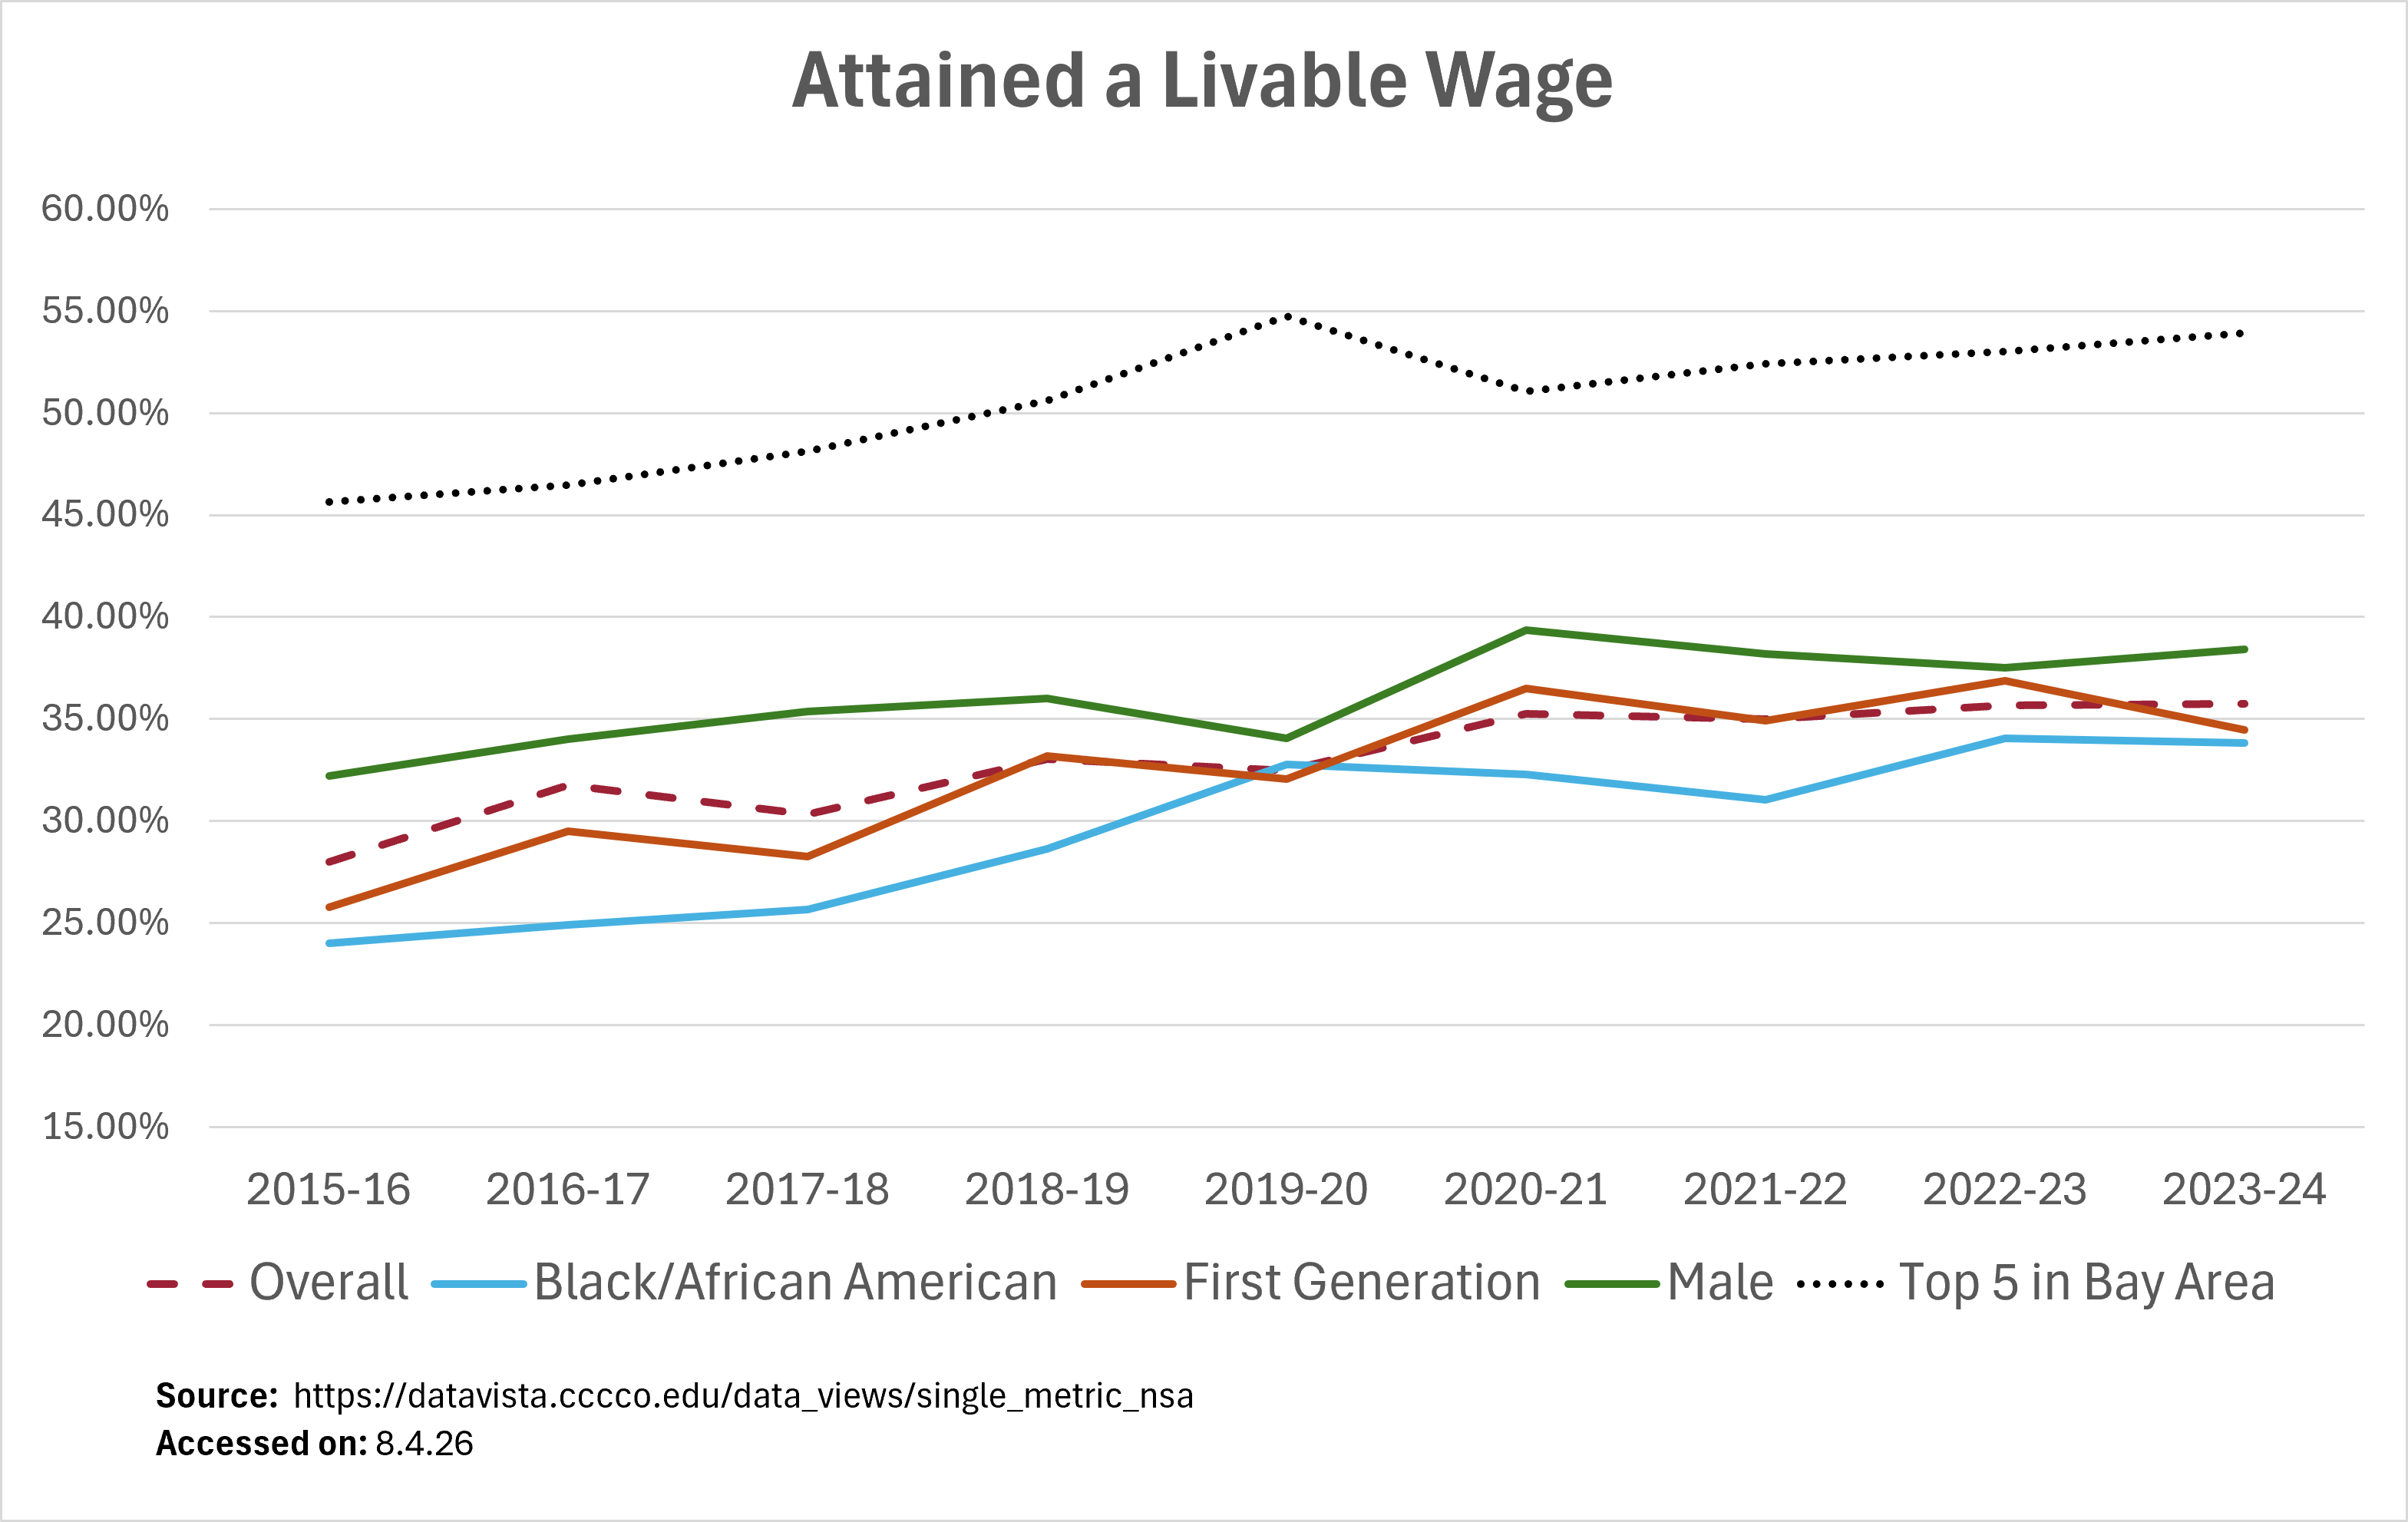
Table Summary
Livable Wage Attainment rates by academic year for all students, Black/African American students, First Generation students, and male students, with a comparison to the top-five Bay Area college benchmark.
| Year | Overall | Black/African American | First Generation | Male | Top 5 in Bay Area |
| 2015-16 | 27.98% | 24.00% | 25.79% | 32.20% | 45.64% |
| 2016-17 | 31.77% | 24.89% | 29.51% | 34.03% | 46.47% |
| 2017-18 | 30.34% | 25.65% | 28.27% | 35.37% | 48.14% |
| 2018-19 | 33.03% | 28.63% | 33.19% | 36.02% | 50.61% |
| 2019-20 | 32.47% | 32.79% | 32.06% | 34.03% | 54.76% |
| 2020-21 | 35.24% | 32.29% | 36.50% | 39.35% | 51.07% |
| 2021-22 | 34.99% | 31.03% | 34.93% | 38.19% | 52.42% |
| 2022-23 | 35.69% | 34.07% | 36.86% | 37.50% | 53.02% |
| 2023-24 | 35.76% | 33.84% | 34.48% | 38.40% | 53.93% |