


Goal 2, Objective 2.2, Measures:
1st year Math and English Completion Rates (SEP Metric)
Data Vista Metric Definition: All Cohort Students Who Completed Both Transfer-Level Math and English Within the District in the First Year Aligned with SCFF. Among students in the cohort, the proportion who completed both transfer-level math and English in their first academic year of credit enrollment within the district
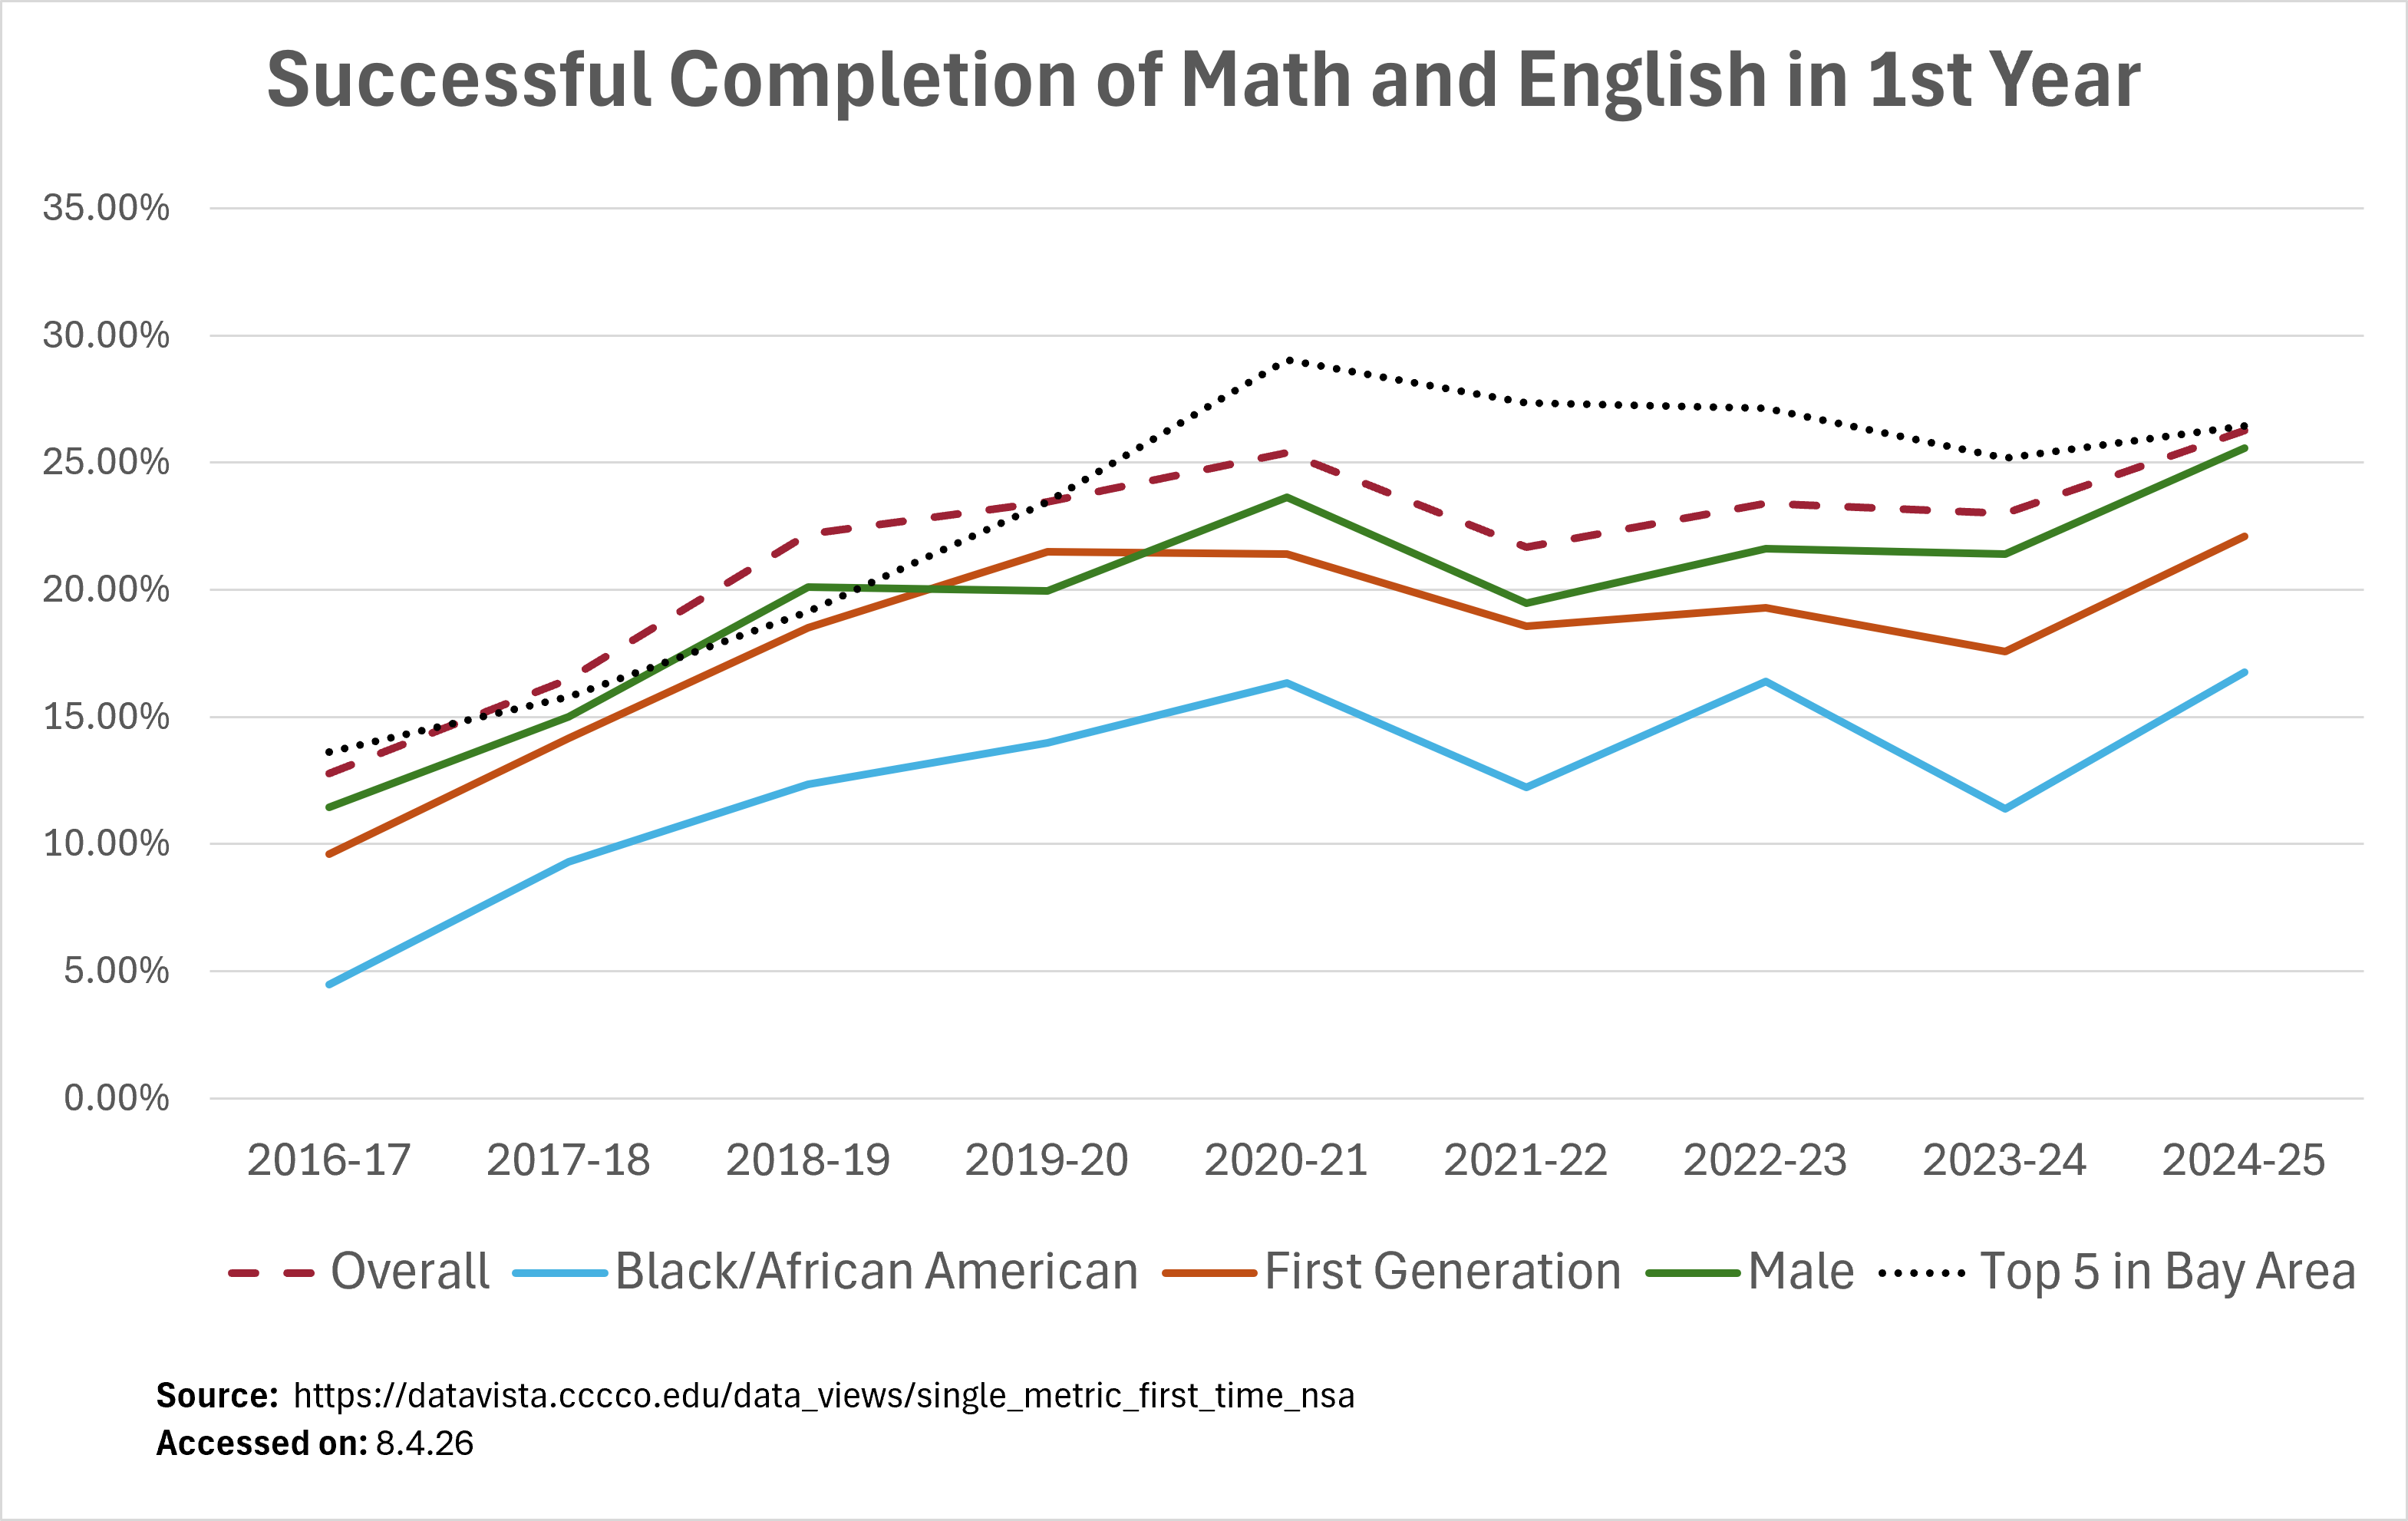
Table Summary
1st Year Math and English completion rates by academic year for all students, Black/African American students, First Generation students, and male students, with a comparison to the top-five Bay Area college benchmark.
| Year | Overall | Black/African American | First Generation | Male | Top 5 in Bay Area |
| 2016-17 | 12.78% | 4.49% | 9.60% | 11.46% | 13.62% |
| 2017-18 | 16.49% | 9.30% | 14.16% | 15.01% | 15.79% |
| 2018-19 | 22.18% | 12.34% | 18.49% | 20.10% | 19.15% |
| 2019-20 | 23.45% | 13.97% | 21.49% | 19.97% | 23.45% |
| 2020-21 | 25.40% | 16.34% | 21.41% | 23.63% | 29.05% |
| 2021-22 | 21.67% | 12.23% | 18.57% | 19.47% | 27.36% |
| 2022-23 | 23.40% | 16.38% | 19.31% | 21.62% | 27.14% |
| 2023-24 | 22.99% | 11.39% | 17.59% | 21.39% | 25.17% |
| 2024-25 | 26.28% | 16.76% | 22.10% | 25.59% | 26.46% |