


Goal 2, Objective 2.4, Measures:
Degree/Cert within 3 Years (SEP Metric)
Data Vista Metric Definition: All Cohort Students Who Attained the Vision Goal Completion Definition or Who Transferred to a Four-Year Institution. EITHER among students in the cohort, the unduplicated count of students who earned one or more of the following: Chancellor's Office approved certificate, associate degree, and/or CCC baccalaureate degree, and had an enrollment in the selected year in the district that they earned the award within 2, 3, 4, or 6 years. OR among students in the cohort who earned 12 or more units at any time and at any college and who exited the community college system in the selected year, the number of cohort students who enrolled in any four-year postsecondary institution in the subsequent year or 4 years after for 3 year cohort, 5 years after for 4 year cohort and 7 years after for 6 year cohort
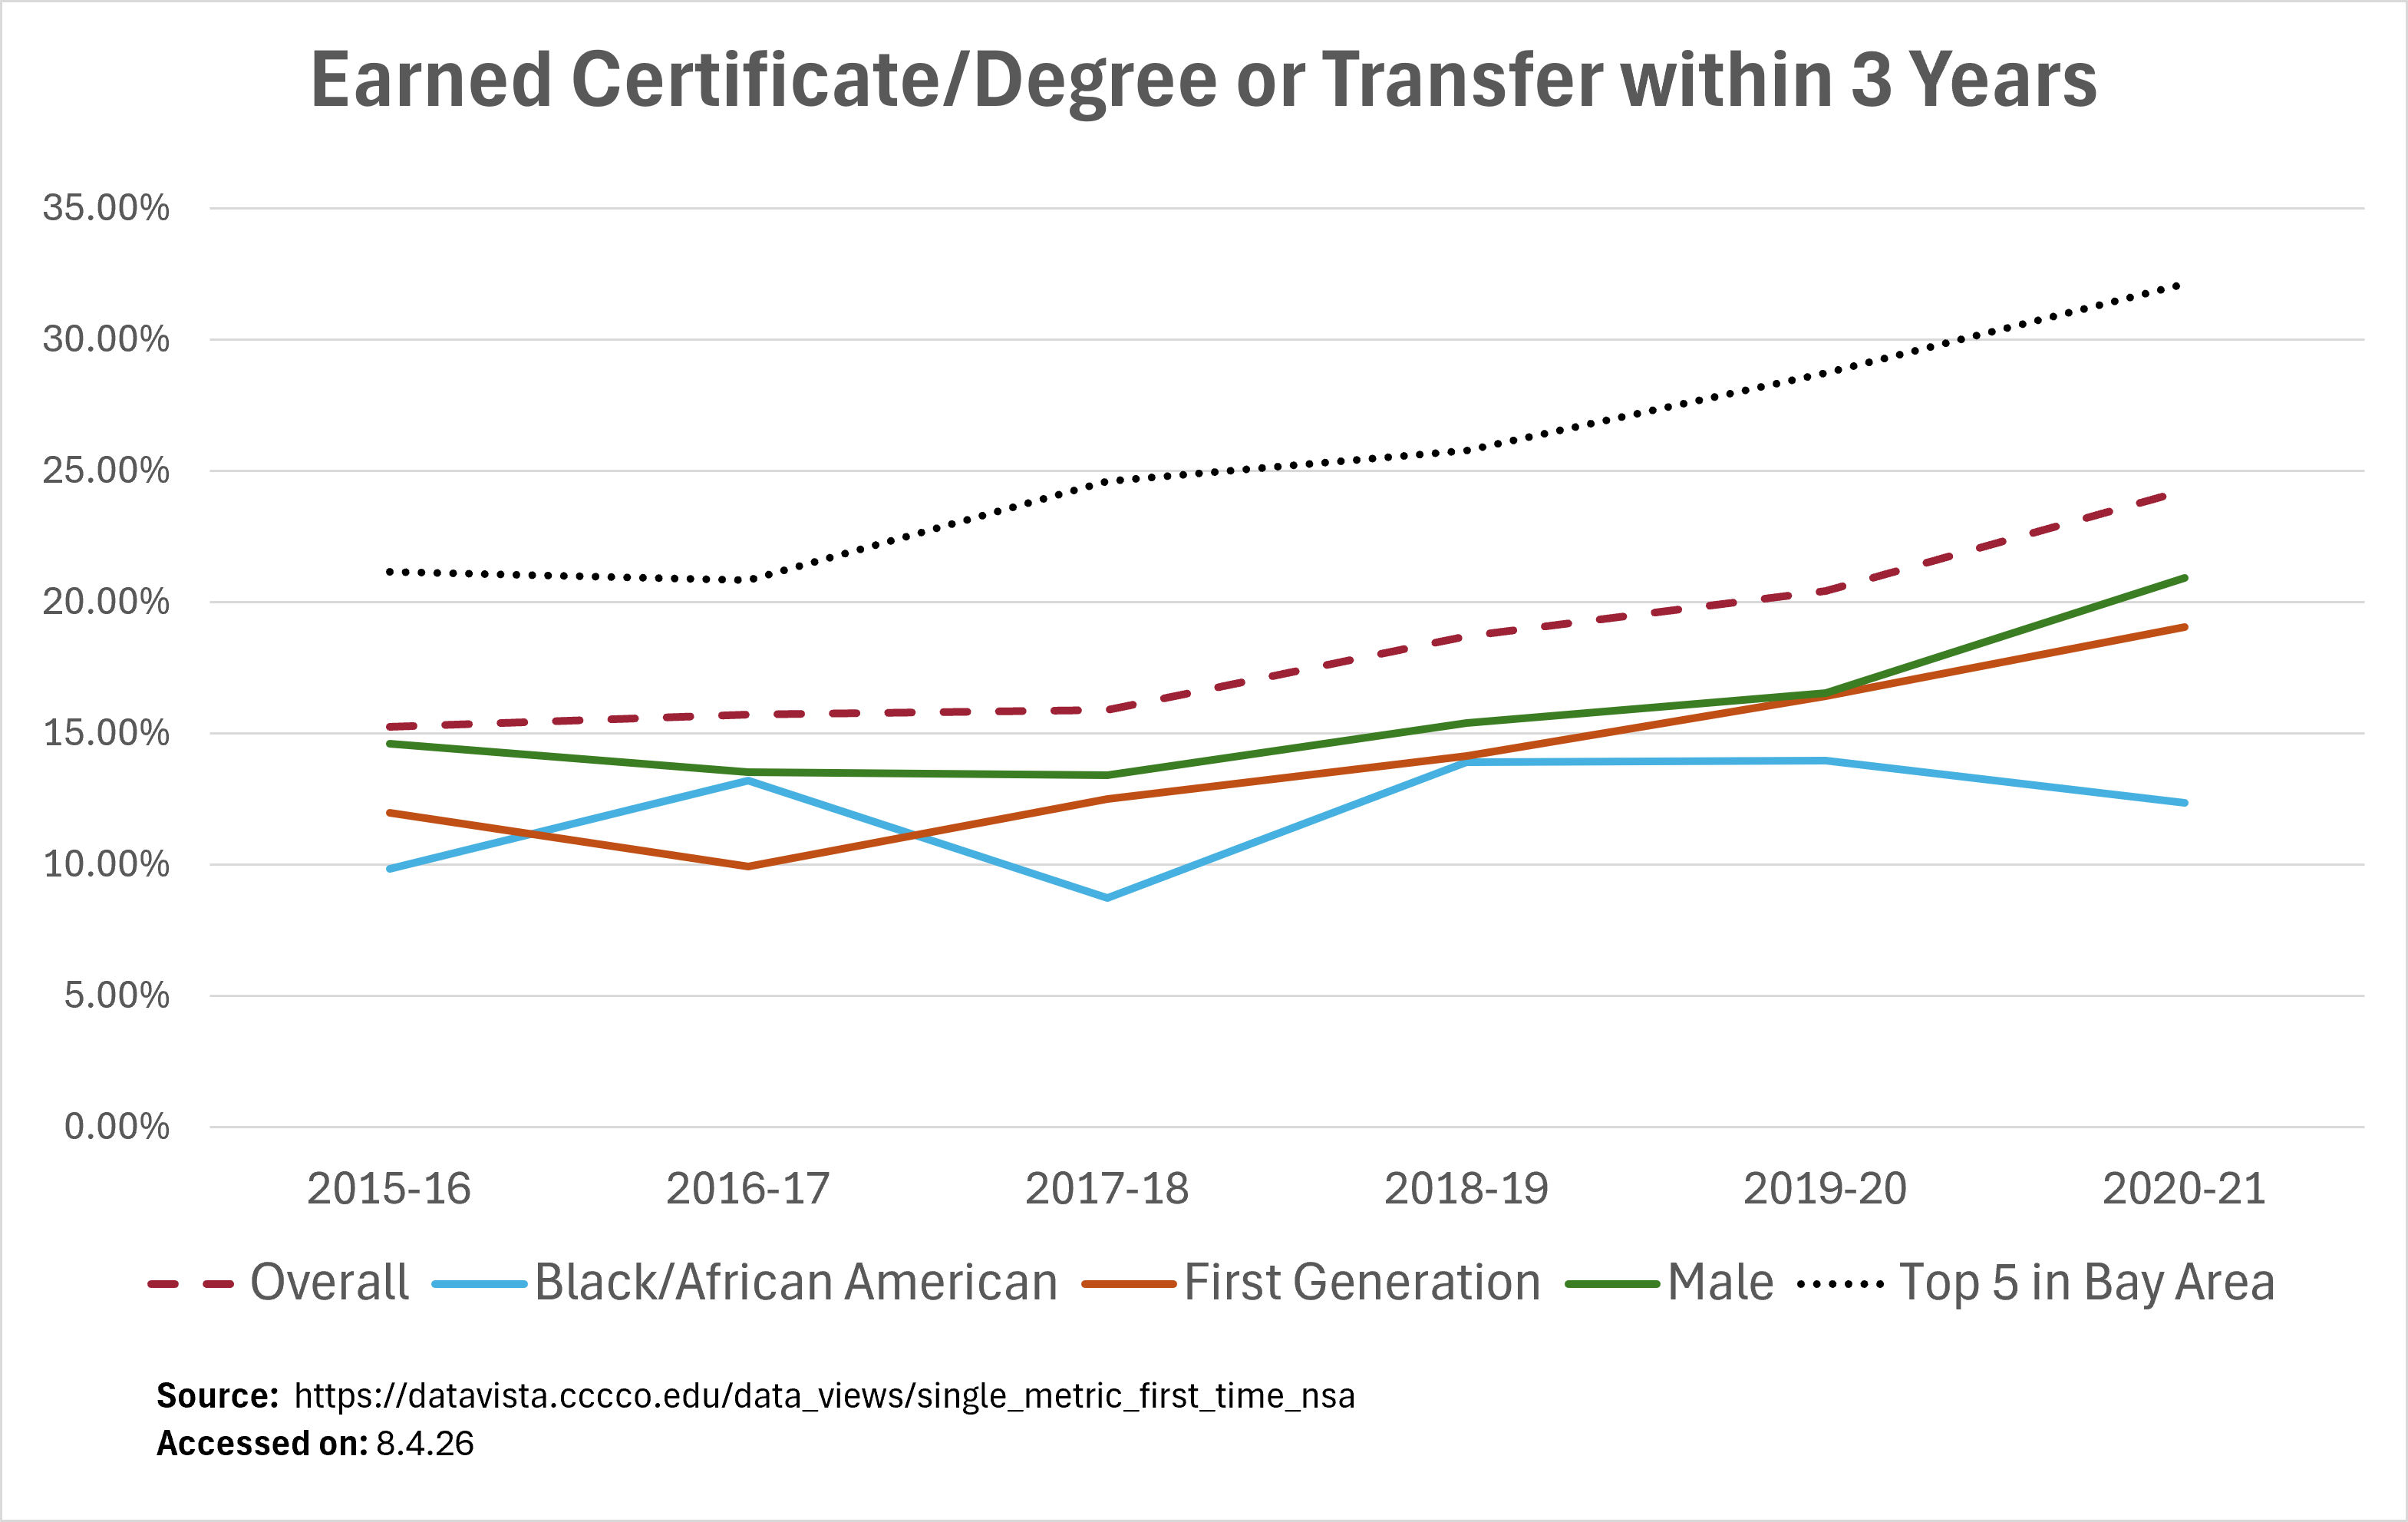
Table Summary
Attainment of Certificate/Degree or transfer within 3 years rates by academic year for all students, Black/African American students, First Generation students, and male students, with a comparison to the top-five Bay Area college benchmark.
| Year | Overall | Black/African American | First Generation | Male | Top 5 in Bay Area |
| 2015-16 | 15.24% | 9.82% | 11.97% | 14.62% | 21.14% |
| 2016-17 | 15.72% | 13.19% | 9.92% | 13.52% | 20.84% |
| 2017-18 | 15.88% | 8.73% | 12.50% | 13.40% | 24.62% |
| 2018-19 | 18.70% | 13.91% | 14.15% | 15.40% | 25.79% |
| 2019-20 | 20.43% | 13.97% | 16.43% | 16.53% | 28.73% |
| 2020-21 | 24.27% | 12.35% | 19.06% | 20.93% | 32.12% |